For those interested in production management using Notion
or who would like to see a demo,
For those who want to make complex information in the manufacturing industry easier to understand.
Productivity
Enhancement App
Productivity Enhancement App
At FRICS Fab, we offer a variety of applications to digitalize all types of operations, including on-site apps and software integration.
Our productivity enhancement app, 'FDiM,' provides applications tailored to customer needs and can be implemented starting from a single app.


Production Management
System -for managers-
Production Management Using Notion It consists of four functions: order management, scheduler, production load management, and actual work hours management. You can proceed with processes in collaboration with workers.
Learn more

Production Management
System -for workers-
Production Management Using Notion Accessible from both smartphones and PCs. You can view orders and actual work hours from your own account and collaborate with administrators.
Learn more

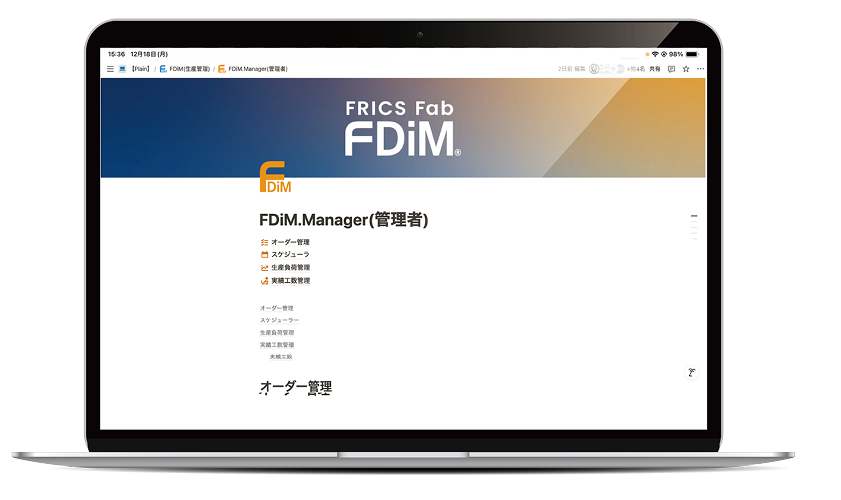
Production Management
System -for managers-
Production Management Using Notion It consists of four functions: order management, scheduler, production load management, and actual work hours management. You can proceed with processes in collaboration with workers.
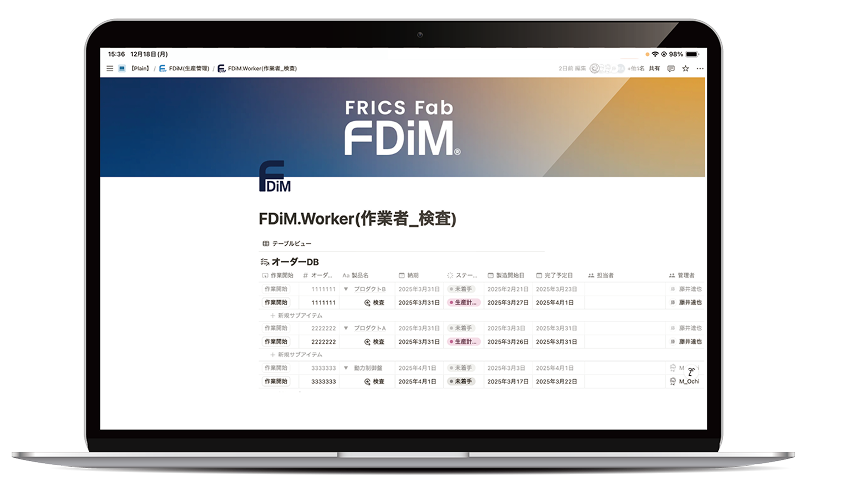
Production Management
System -for workers-
Production Management Using Notion Accessible from both smartphones and PCs. You can view orders and actual work hours from your own account and collaborate with administrators.

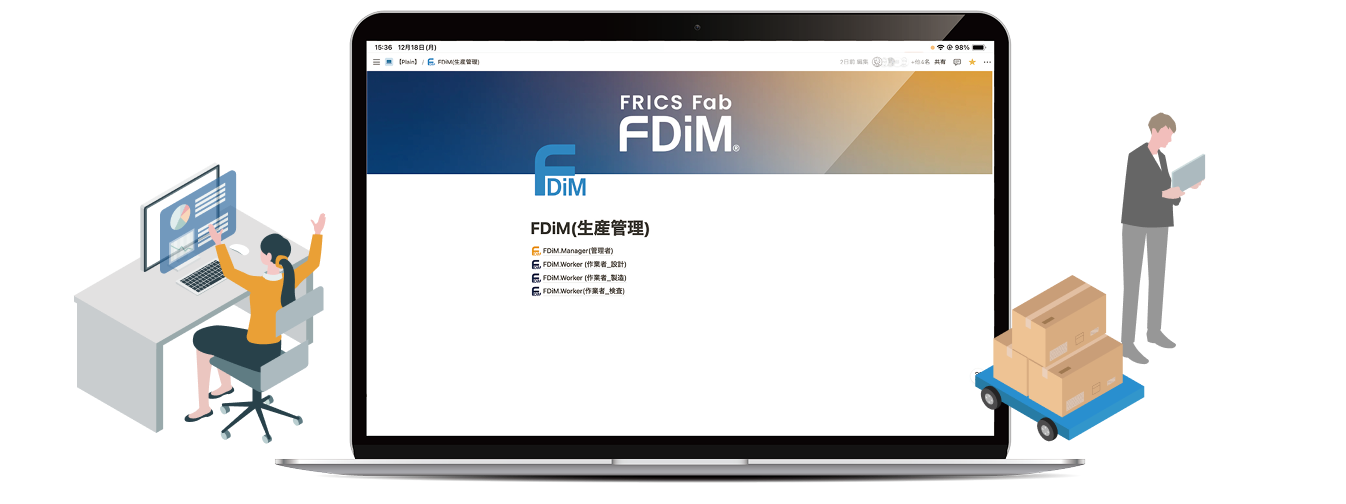
- Flexible Production Management Using Notion
- Notion can organize everything into one tool, including projects, goals, calendars, and roadmaps.
Using Notion for production management brings significant changes to the digital transformation of the manufacturing site.

- Customizable In-House with Low Running Costs
- As a no-code application system, it can be customized in-house. Additionally, it can be maintained at low running costs, reducing the financial burden.

- Easy Operation for Budget Management and Analysis!
- With simple operations, you can manage labor tasks. It also simplifies data accumulation, allowing for budget management and analysis, thereby improving work efficiency.
Case Example
Here is one of the changes that have occurred in control panel manufacturing.
- Own-brand denim manufacturing
Soja Caitac Factory, CAITAC INTERNATIONAL, INC. To be freed from EXCEL management
Secure your management time
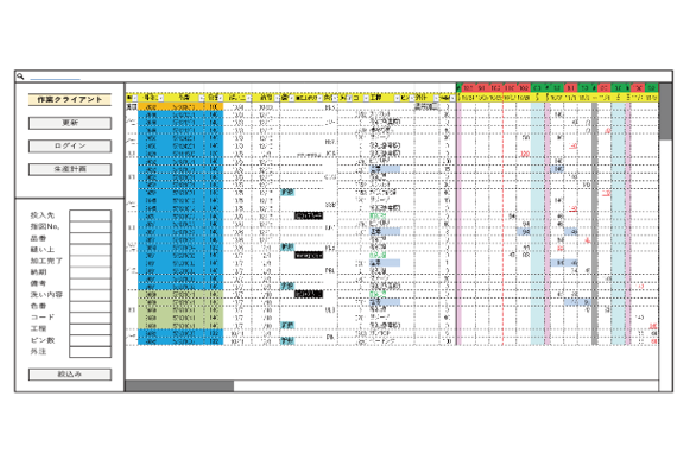
EXCEL Management

It was managed with a complexly assembled EXCEl. We had to monitor PCs all day long because changes in production plans occur frequently and we have to respond flexibly.
Managers are unable to do any work other than production management because they are doing their best to reflect the current plan.
Production Management System
The introduction of a production control system simplifies operations and allows time for management tasks as well as more efficient production control.
Explore the technology of TOYODENSO
DX Factory Tour
You can see these changes with DX improvements using the technology of TOYODENSO.
For more information, please visit the factory tour reservation site.